
Leicester City Council elections are held every four years. Leicester City Council is the local authority for the unitary authority of Leicester in Leicestershire, England. Until 1 April 1997 it was a non-metropolitan district. Since 2011 it has also had a directly elected mayor. Since the last boundary changes in 2015, 54 councillors have been elected from 21 wards.[1]
Summary of results
| Political group | Councillors | |||||||||
|---|---|---|---|---|---|---|---|---|---|---|
| 1996 | 1999 | 2003 | 2007 | 2011 | 2015 | 2019 | 2023 | Current | ||
| Labour | 41 | 30 | 20 | 38 | 52 | 52 | 53 | 31 | 31 | |
| Liberal Democrat | 8 | 16 | 25 | 6 | 1 | 1 | 1 | 3 | 3 | |
| Conservative | 7 | 10 | 9 | 8 | 1 | 1 | 0 | 17 | 17 | |
| Green | 0 | 0 | 0 | 2 | 0 | 0 | 0 | 3 | 3 | |
| Independent | 0 | 0 | 0 | 0 | 0 | 0 | 0 | 0 | 0 | |
| Total | 56 | 56 | 54 | 54 | 54 | 54 | 54 | 54 | 54 | |
Council elections
- 1973 Leicester City Council election
- 1976 Leicester City Council election
- 1979 Leicester City Council election
- 1983 Leicester City Council election (New ward boundaries)[2]
- 1984 Leicester City Council election
- 1986 Leicester City Council election
- 1987 Leicester City Council election
- 1991 Leicester City Council election (City boundary changes took place but the number of seats remained the same)[3]
- 1995 Leicester City Council election
- 1996 Leicester City Council election
- 1998 Leicester City Council election
- 1999 Leicester City Council election
- 2003 Leicester City Council election (New ward boundaries reduced the number of seats by 2)[4][5][6]
- 2007 Leicester City Council election
- 2011 Leicester City Council election
- 2015 Leicester City Council election (New ward boundaries)[1]
- 2019 Leicester City Council election
- 2023 Leicester City Council election
Mayoral elections
- Leicester mayoral election, 2011
- Leicester mayoral election, 2015
- Leicester mayoral election, 2019
- Leicester mayoral election, 2023
Results maps
-
 2011 results map
 -
 2015 results map
 -
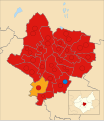
 2019 results map
 -
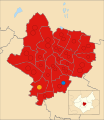
 2023 results map


By-election results
1995-1999
| Party | Candidate | Votes | % | ±% | |
|---|---|---|---|---|---|
| Labour | 1,608 | 69.3 | |||
| Conservative | 461 | 19.9 | |||
| Liberal Democrats | 140 | 6.0 | |||
| Socialist Labour | 112 | 4.8 | |||
| Majority | 1,147 | 49.4 | |||
| Turnout | 2,321 | 37.1 | |||
| Labour hold | Swing | ||||
| Party | Candidate | Votes | % | ±% | |
|---|---|---|---|---|---|
| Liberal Democrats | 744 | 51.8 | +38.8 | ||
| Labour | 318 | 22.2 | -38.2 | ||
| Conservative | 282 | 19.7 | -1.2 | ||
| Socialist Labour | 91 | 6.3 | +6.3 | ||
| Majority | 426 | 29.6 | |||
| Turnout | 1,435 | ||||
| Liberal Democrats gain from Labour | Swing | ||||
| Party | Candidate | Votes | % | ±% | |
|---|---|---|---|---|---|
| Labour | 1,205 | 56.0 | -5.1 | ||
| Conservative | 513 | 23.8 | +13.8 | ||
| Liberal Democrats | 334 | 15.5 | +1.5 | ||
| Socialist Labour | 101 | 4.7 | +4.7 | ||
| Majority | 692 | 32.2 | |||
| Turnout | 2,153 | ||||
| Labour hold | Swing | ||||
| Party | Candidate | Votes | % | ±% | |
|---|---|---|---|---|---|
| Labour | 839 | 46.7 | -14.8 | ||
| Liberal Democrats | 376 | 20.9 | +8.6 | ||
| Conservative | 374 | 20.8 | +2.3 | ||
| Green | 125 | 7.0 | -0.7 | ||
| Socialist Labour | 81 | 4.5 | +4.5 | ||
| Majority | 463 | 25.8 | |||
| Turnout | 1,795 | ||||
| Labour hold | Swing | ||||
1999-2003
| Party | Candidate | Votes | % | ±% | |
|---|---|---|---|---|---|
| Conservative | Jean Middleton | 955 | 43.1 | -5.2 | |
| Liberal Democrats | Alison Bannatyne | 683 | 30.8 | +18.5 | |
| Labour | Patrick Kitterick | 525 | 23.7 | -10.8 | |
| Green | Anthony Walker | 51 | 2.3 | -2.6 | |
| Majority | 272 | 12.3 | |||
| Turnout | 2,214 | 28.8 | |||
| Conservative hold | Swing | ||||
| Party | Candidate | Votes | % | ±% | |
|---|---|---|---|---|---|
| Conservative | 1,060 | 43.7 | -11.3 | ||
| Labour | 640 | 26.4 | -9.5 | ||
| Liberal Democrats | 544 | 22.4 | +13.3 | ||
| BNP | 115 | 4.7 | +4.7 | ||
| Independent | 67 | 2.8 | +2.8 | ||
| Majority | 420 | 17.3 | |||
| Turnout | 2,426 | 32.4 | |||
| Conservative hold | Swing | ||||
| Party | Candidate | Votes | % | ±% | |
|---|---|---|---|---|---|
| Liberal Democrats | M Farmer | 998 | 41.2 | +18.4 | |
| Labour | J Blackmore | 905 | 37.3 | -9.3 | |
| Conservative | D Keeling | 232 | 9.6 | +0.0 | |
| BNP | E Scott | 202 | 8.3 | +8.3 | |
| Green | T O'Connel | 66 | 2.7 | +2.7 | |
| Socialist Labour | D Roberts | 22 | 0.9 | +0.9 | |
| Majority | 93 | 3.9 | |||
| Turnout | 2,425 | 39.6 | |||
| Liberal Democrats gain from Labour | Swing | ||||
2003-2007
| Party | Candidate | Votes | % | ±% | |
|---|---|---|---|---|---|
| Liberal Democrats | A Tessier | 742 | 47.4 | +8.4 | |
| Labour | N Holden | 543 | 34.7 | -6.4 | |
| Conservative | R Taylor | 113 | 7.2 | -5.3 | |
| Socialist Labour | V Smalley | 101 | 6.5 | +6.5 | |
| BNP | K Yates | 66 | 4.2 | +4.2 | |
| Majority | 199 | 12.7 | |||
| Turnout | 1,565 | 25.2 | |||
| Liberal Democrats hold | Swing | ||||
| Party | Candidate | Votes | % | ±% | |
|---|---|---|---|---|---|
| Conservative | Nigel Porter | 938 | 45.8 | -5.0 | |
| Liberal Democrats | R Webber-Jones | 494 | 24.1 | +2.1 | |
| Labour | R Craven-Griffiths | 443 | 21.7 | +2.3 | |
| Green | R Ball | 171 | 8.4 | +0.6 | |
| Majority | 444 | 21.7 | |||
| Turnout | 2,046 | 25.4 | |||
| Conservative hold | Swing | ||||
| Party | Candidate | Votes | % | ±% | |
|---|---|---|---|---|---|
| Conservative | R Grant | 1,646 | 45.9 | +14.4 | |
| Liberal Democrats | J Bhoot | 1,089 | 30.4 | -14.3 | |
| Labour | B Fairbairn | 605 | 16.9 | +1.7 | |
| Green | M Follet | 247 | 6.9 | -1.8 | |
| Majority | 557 | 15.5 | |||
| Turnout | 3,587 | 28.3 | |||
| Conservative gain from Liberal Democrats | Swing | ||||
| Party | Candidate | Votes | % | ±% | |
|---|---|---|---|---|---|
| Labour | A Kavia | 1,809 | 65.4 | +16.7 | |
| Conservative | S Gajjar | 459 | 16.6 | +6.6 | |
| Liberal Democrats | P Jethwa | 349 | 12.6 | -2.7 | |
| Green | G Force | 151 | 5.5 | +1.7 | |
| Majority | 1,350 | 48.8 | |||
| Turnout | 2,768 | 36.6 | |||
| Labour hold | Swing | ||||
| Party | Candidate | Votes | % | ±% | |
|---|---|---|---|---|---|
| Labour | Violet Dempster | 952 | 54.4 | +5.9 | |
| Conservative | Martin Wright | 342 | 19.5 | -7.6 | |
| Liberal Democrats | John Taylor | 295 | 16.8 | -4.5 | |
| BNP | John Chapman | 161 | 9.2 | +9.2 | |
| Majority | 610 | 34.9 | |||
| Turnout | 1,750 | 18.2 | |||
| Labour hold | Swing | ||||
| Party | Candidate | Votes | % | ±% | |
|---|---|---|---|---|---|
| Labour | 1,751 | 66.1 | +0.7 | ||
| Liberal Democrats | Rukmani Patel | 509 | 19.2 | +6.6 | |
| Conservative | 265 | 10.0 | -6.6 | ||
| Green | 122 | 4.6 | -0.9 | ||
| Majority | 1,242 | 46.9 | +10.2 | ||
| Turnout | 2,647 | 34.3 | -2.4 | ||
| Labour hold | Swing | ||||
2007-2011
| Party | Candidate | Votes | % | ±% | |
|---|---|---|---|---|---|
| Labour | Lynn Senior | 611 | 31.7 | +5.1 | |
| Green | Dave Dixey | 519 | 26.9 | -8.6 | |
| Conservative | Jacob Wilkinson | 435 | 22.6 | +7.2 | |
| Liberal Democrats | Joan Garrity | 292 | 15.1 | -3.1 | |
| UKIP | Zoey Lucas | 41 | 2.1 | -0.5 | |
| Liberal | Gareth Henry | 31 | 1.6 | -0.1 | |
| Majority | 92 | 4.8 | |||
| Turnout | 1,929 | 12.7 | |||
| Labour gain from Green | Swing | +6.8 | |||
| Party | Candidate | Votes | % | ±% | |
|---|---|---|---|---|---|
| Labour | Virginia Cleaver | 1,446 | 35.3 | -2.5 | |
| Conservative | Jon Humberstone | 999 | 24.4 | +2.8 | |
| Liberal Democrats | Scott Kennedy-Lount | 908 | 22.2 | +5.8 | |
| BNP | Adrian Waudby | 745 | 18.2 | -3.2 | |
| Majority | 447 | 10.9 | |||
| Turnout | 4,098 | ||||
| Labour hold | Swing | -2.65 | |||
2011-2015
| Party | Candidate | Votes | % | ±% | |
|---|---|---|---|---|---|
| Labour | Vijay Singh Riyait | 1,190 | 47.9 | +0.8 | |
| Conservative | Dipak Joshi | 562 | 22.6 | +9.0 | |
| Independent | Terry McGreal | 352 | 14.1 | n/a | |
| Liberal Democrats | John Robert Taylor | 212 | 8.5 | +1.8 | |
| TUSC | Tessa Warrington | 165 | 6.6 | n/a | |
| Majority | 628 | 25.3 | |||
| Turnout | 2,481 | 24.1 | |||
| Labour hold | Swing | -7.5 | |||
2015-2019
| Party | Candidate | Votes | % | ±% | |
|---|---|---|---|---|---|
| Labour | Danny Myers | 4,272 | 64.6 | +27.3 | |
| Conservative | Ali Douas | 1,015 | 15.4 | -2.1 | |
| Green | Oli Young-Jones | 946 | 14.3 | -13.5 | |
| Liberal Democrats | Lewis Hastie | 379 | 5.7 | -3.0 | |
| Majority | 3,257 | 49.3 | |||
| Turnout | 6,612 | ||||
| Labour hold | Swing | ||||
| Party | Candidate | Votes | % | ±% | |
|---|---|---|---|---|---|
| Labour | Elaine Pantling | 556 | 53.15 | ||
| Liberal Democrats | Tony Faithfull-Wright | 320 | 30.59 | ||
| Conservative | Christopher Michael Doyle | 170 | 15.91 | ||
| Majority | 236 | ||||
| Turnout | 1046 | 12.5 | |||
| Labour hold | Swing | ||||
| Party | Candidate | Votes | % | ±% | |
|---|---|---|---|---|---|
| Labour | Padmini Chamund | 5,477 | 86.6 | +17.0 | |
| Conservative | Khandubhai Patel | 412 | 6.5 | -11.9 | |
| Liberal Democrats | Hash Chandarana | 238 | 3.8 | +3.8 | |
| Green | Ursula Bilson | 199 | 3.1 | -2.6 | |
| Majority | 5,065 | 80.1 | |||
| Turnout | 6,326 | ||||
| Labour hold | Swing | ||||
2019-2023
| Party | Candidate | Votes | % | ±% | |
|---|---|---|---|---|---|
| Labour | Vandevi Pandya | 3,306 | 47.2% | ||
| Conservative | Abdul Osman | 2565 | 36.6% | ||
| Green | Aasiya Bora | 241 | 3.4% | ||
| Liberal Democrats | Asit Sodha | 240 | 3.4% | ||
| TUSC | Kumaran Bose | 117 | 1.7% | ||
| Reform UK | Raj Solanki | 89 | 1.3% | ||
| For Britain | David Haslett | 69 | 1.0% | ||
| Independent | Charnjit Singh Sagoo | 61 | 0.9% | ||
| Communist | Andrea Burford | 33 | 0.5% | ||
| Majority | 741 | 10.6% | |||
| Turnout | 7,004 | 45.0% | |||
| Labour hold | Swing | -26.5 | |||
| Party | Candidate | Votes | % | ±% | |
|---|---|---|---|---|---|
| Conservative | Daniel Crewe | 1,062 | 44.7% | ||
| Labour | Abdul Jalil | 790 | 33.2% | ||
| Liberal Democrats | Bicram Athwal | 262 | 11.0% | ||
| Green | Pam Bellinger | 190 | 8.0% | ||
| Reform UK | Raj Solanki | 37 | 1.6% | ||
| For Britain | David Haslett | 37 | 1.6% | ||
| Majority | 272 | 11.5 | |||
| Conservative gain from Labour | Swing | 17.0% | |||
| Party | Candidate | Votes | % | ±% | |
|---|---|---|---|---|---|
| Labour | Shahid Ullah Khan | 1,557 | 38.8 | -20.8 | |
| Conservative | Jenny Joannuo | 1382 | 34.4 | +11.9 | |
| Liberal Democrats | Zuffar Haq | 830 | 20.7 | +12.2 | |
| Green | Ursula Bilson | 200 | 5.0 | -7.6 | |
| For Britain | David George | 45 | 1.1 | +1.1 | |
| Majority | 175 | 4.4 | -22.4 | ||
| Turnout | 4014 | 30.7 | -5.3 | ||
| Labour hold | Swing | -16.4 | |||
| Party | Candidate | Votes | % | ±% | |
|---|---|---|---|---|---|
| Conservative | Sanjay Modhwadia | 3,441 | 49.6% | ||
| Green | Aasiya Bora | 1,790 | 25.8% | ||
| Labour | Rajul Tejura | 1,563 | 22.5% | ||
| Liberal Democrats | Jitesh Dave | 100 | 1.4% | ||
| TUSC | Tessa Warrington | 45 | 0.6% | ||
| Majority | 1,651 | 23.8% | |||
| Turnout | 6,934 | ||||
| Conservative gain from Labour | Swing | 41.3% | |||
References
- ^ a b "The Leicester (Electoral Changes) Order 2014", legislation.gov.uk, The National Archives, SI 2014/3339, retrieved 17 August 2022
- ^ legislation.gov.uk - The City of Leicester (Electoral Arrangements) Order 1979. Retrieved on 19 November 2015.
- ^ legislation.gov.uk - The Leicestershire (District Boundaries) Order 1987. Retrieved on 6 November 2015.
- ^ legislation.gov.uk - The City of Leicester (Electoral Changes) Order 2002. Retrieved on 4 October 2015.
- ^ "Local elections". BBC News Online. Retrieved 7 September 2009.
- ^ "Councillors, Democracy and Elections". Leicester City Council. Retrieved 7 September 2009.
- ^ "Eyres Monsell Ward May 2002". Leicester City Council. Archived from the original on 27 August 2002. Retrieved 7 September 2009.
- ^ "Westcotes Ward 11th December 2003". Leicester City Council. Archived from the original on 14 June 2011. Retrieved 7 September 2009.
- ^ "Aylestone Ward 23rd September 2004". Leicester City Council. Archived from the original on 14 June 2011. Retrieved 7 September 2009.
- ^ "Knighton Ward 4th November 2004". Leicester City Council. Archived from the original on 14 June 2011. Retrieved 7 September 2009.
- ^ "Belgrave Ward 17th February 2005". Leicester City Council. Archived from the original on 16 January 2006. Retrieved 7 September 2009.
- ^ a b "Strong swing to Labour in local byelections". guardian.co.uk. 15 July 2005. Retrieved 7 September 2009.
- ^ "Victory for Labour at Leicester by-election". this is leicestershire.co.uk. 11 September 2009. Archived from the original on 5 May 2013. Retrieved 23 September 2009.
- ^ "Local issues will decide poll result, say hopefuls". this is leicestershire.co.uk. 18 August 2009. Archived from the original on 5 May 2013. Retrieved 23 September 2009.
- ^ "Eyres Monsell By-Election". Leicester City Council. Archived from the original on 13 June 2010. Retrieved 21 May 2010.
- ^ "Leicester City Council - Elections". Archived from the original on 11 May 2013. Retrieved 10 May 2013.
- ^ "Local Elections Archive Project — Castle Ward". www.andrewteale.me.uk. Retrieved 26 August 2022.
- ^ "Eyres Monsell ward by-election". Archived from the original on 11 March 2018.
- ^ "Local Elections Archive Project — Belgrave Ward". www.andrewteale.me.uk. Retrieved 26 August 2022.
