| |||||||||||||||||||||||||||||||||
13 of the 39 seats to Stevenage Borough Council 20 seats needed for a majority | |||||||||||||||||||||||||||||||||
|---|---|---|---|---|---|---|---|---|---|---|---|---|---|---|---|---|---|---|---|---|---|---|---|---|---|---|---|---|---|---|---|---|---|
| |||||||||||||||||||||||||||||||||
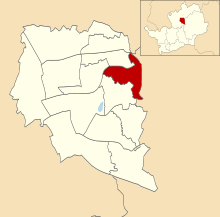
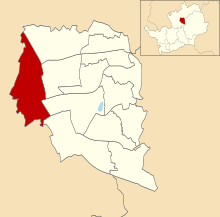
 Map showing the results of contested wards in the 2007 Stevenage Borough Council elections. | |||||||||||||||||||||||||||||||||
| |||||||||||||||||||||||||||||||||
Elections to Stevenage Council were held on 3 May 2007. One third of the council was up for election; the seats which were last contested in 2003. The Labour Party stayed in overall control of the council.
After the election, the composition of the council was:
- Labour 32
- Liberal Democrat 4
- Conservative 3
Election result
| Party | Seats | Gains | Losses | Net gain/loss | Seats % | Votes % | Votes | +/− | |
|---|---|---|---|---|---|---|---|---|---|
| Labour | 11 | 0 | 0 | 0 | 84.6 | 46.8 | 10,130 | +0.4% | |
| Conservative | 1 | 0 | 0 | 0 | 7.7 | 30.2 | 6,533 | +0.5% | |
| Liberal Democrats | 1 | 0 | 0 | 0 | 7.7 | 21.3 | 4,612 | -0.5% | |
| BNP | 0 | 0 | 0 | 0 | 0 | 1.0 | 211 | +1.0% | |
| Green | 0 | 0 | 0 | 0 | 0 | 0.8 | 172 | -0.1% | |
Ward results
Bandley Hill

| Party | Candidate | Votes | % | ±% | |
|---|---|---|---|---|---|
| Labour | Jackie Hollywell | 805 | 51.8 | +0.9 | |
| Conservative | Freda Warner | 474 | 30.5 | +3.7 | |
| Liberal Democrats | Gordon Knight | 276 | 17.7 | -4.6 | |
| Majority | 331 | 21.3 | -2.8 | ||
| Turnout | 1,555 | 32.4 | |||
| Labour hold | Swing | ||||
Bedwell

| Party | Candidate | Votes | % | ±% | |
|---|---|---|---|---|---|
| Labour | Liz Harrington | 1,037 | 60.7 | -6.4 | |
| Conservative | Christine St. Leitner | 430 | 25.2 | -7.7 | |
| Liberal Democrats | Sydney Grubert | 241 | 14.1 | +14.1 | |
| Majority | 607 | 35.5 | +1.3 | ||
| Turnout | 1,708 | 36.3 | |||
| Labour hold | Swing | ||||
Chells

| Party | Candidate | Votes | % | ±% | |
|---|---|---|---|---|---|
| Labour | Howard Burrell | 771 | 41.9 | -3.6 | |
| Liberal Democrats | Audrey Griffith | 750 | 40.8 | +7.3 | |
| Conservative | Julie Seddon | 318 | 17.3 | -3.7 | |
| Majority | 21 | 1.1 | -10.9 | ||
| Turnout | 1,839 | 39.6 | |||
| Labour hold | Swing | ||||
Longmeadow

| Party | Candidate | Votes | % | ±% | |
|---|---|---|---|---|---|
| Labour | Monika Cherney-Craw | 689 | 41.8 | -5.1 | |
| Conservative | Matthew Hurst | 645 | 39.2 | +4.9 | |
| Liberal Democrats | Ralph Baskerville | 313 | 19.0 | +0.2 | |
| Majority | 44 | 2.6 | -10.0 | ||
| Turnout | 1,647 | 37.9 | |||
| Labour hold | Swing | ||||
Manor

| Party | Candidate | Votes | % | ±% | |
|---|---|---|---|---|---|
| Liberal Democrats | Robin Parker | 1,091 | 54.4 | +1.8 | |
| Conservative | Susan Smith | 465 | 23.2 | -2.2 | |
| Labour | Joseph Sherry | 449 | 22.4 | +0.4 | |
| Majority | 626 | 31.2 | +4.0 | ||
| Turnout | 2,005 | 41.3 | |||
| Liberal Democrats hold | Swing | ||||
Martins Wood

| Party | Candidate | Votes | % | ±% | |
|---|---|---|---|---|---|
| Labour | Michael Patston | 680 | 43.6 | +0.2 | |
| Conservative | Dilys Clark | 608 | 39.0 | +4.6 | |
| Liberal Democrats | Barbara Segadelli | 272 | 17.4 | -4.8 | |
| Majority | 72 | 4.6 | -4.4 | ||
| Turnout | 1,560 | 34.3 | |||
| Labour hold | Swing | ||||
Old Town

| Party | Candidate | Votes | % | ±% | |
|---|---|---|---|---|---|
| Labour | Michael Downing | 1,018 | 49.0 | +3.4 | |
| Conservative | James Fraser | 700 | 33.7 | +0.2 | |
| Liberal Democrats | Margaret Latham | 189 | 9.1 | -2.6 | |
| Green | Stuart Madgin | 172 | 8.3 | -0.9 | |
| Majority | 318 | 15.3 | +3.2 | ||
| Turnout | 2,079 | 43.1 | |||
| Labour hold | Swing | ||||
Pin Green

| Party | Candidate | Votes | % | ±% | |
|---|---|---|---|---|---|
| Labour | Reg Smith | 848 | 51.6 | -0.8 | |
| Conservative | Leslie Clark | 378 | 23.0 | +1.6 | |
| BNP | Michael Green | 211 | 12.9 | +12.9 | |
| Liberal Democrats | Mary Griffith | 205 | 12.5 | +1.8 | |
| Majority | 470 | 28.6 | -2.4 | ||
| Turnout | 1,642 | 37.3 | |||
| Labour hold | Swing | ||||
Roebuck

| Party | Candidate | Votes | % | ±% | |
|---|---|---|---|---|---|
| Labour | John Gardner | 816 | 52.2 | +2.2 | |
| Conservative | Roger Gill | 480 | 30.7 | +1.9 | |
| Liberal Democrats | Denise Baskerville | 266 | 17.0 | -4.2 | |
| Majority | 336 | 21.5 | +0.3 | ||
| Turnout | 1,562 | 34.7 | |||
| Labour hold | Swing | ||||
St Nicholas

| Party | Candidate | Votes | % | ±% | |
|---|---|---|---|---|---|
| Labour | Ralph Raynor | 742 | 50.8 | +0.1 | |
| Conservative | Andrew Elwell | 399 | 27.3 | +1.2 | |
| Liberal Democrats | Heather Snell | 320 | 21.9 | -1.3 | |
| Majority | 343 | 23.5 | -1.1 | ||
| Turnout | 1,461 | 33.8 | |||
| Labour hold | Swing | ||||
Shephall

| Party | Candidate | Votes | % | ±% | |
|---|---|---|---|---|---|
| Labour | Ann Webb | 806 | 56.3 | +1.2 | |
| Conservative | Anita Speight | 348 | 24.3 | +5.3 | |
| Liberal Democrats | Nicholas Baskerville | 278 | 19.4 | -6.5 | |
| Majority | 458 | 32.0 | +2.8 | ||
| Turnout | 1,432 | 32.6 | |||
| Labour hold | Swing | ||||
Symonds Green

| Party | Candidate | Votes | % | ±% | |
|---|---|---|---|---|---|
| Labour | David Kissane | 1,040 | 61.6 | +7.7 | |
| Conservative | Matthew Wyatt | 470 | 27.8 | -2.8 | |
| Liberal Democrats | Clive Hearmon | 179 | 10.6 | -4.9 | |
| Majority | 570 | 33.8 | +10.5 | ||
| Turnout | 1,689 | 38.8 | |||
| Labour hold | Swing | ||||
Woodfield

| Party | Candidate | Votes | % | ±% | |
|---|---|---|---|---|---|
| Conservative | Graham Clark | 818 | 55.3 | +0.9 | |
| Labour | Richard Rawlings | 429 | 29.0 | +3.6 | |
| Liberal Democrats | Katherine Lloyd | 232 | 15.7 | -4.5 | |
| Majority | 389 | 26.3 | -2.7 | ||
| Turnout | 1,479 | 37.1 | |||
| Conservative hold | Swing | ||||
